Query Plan Analysis: Reading the Salesforce Optimizer Like an Architect
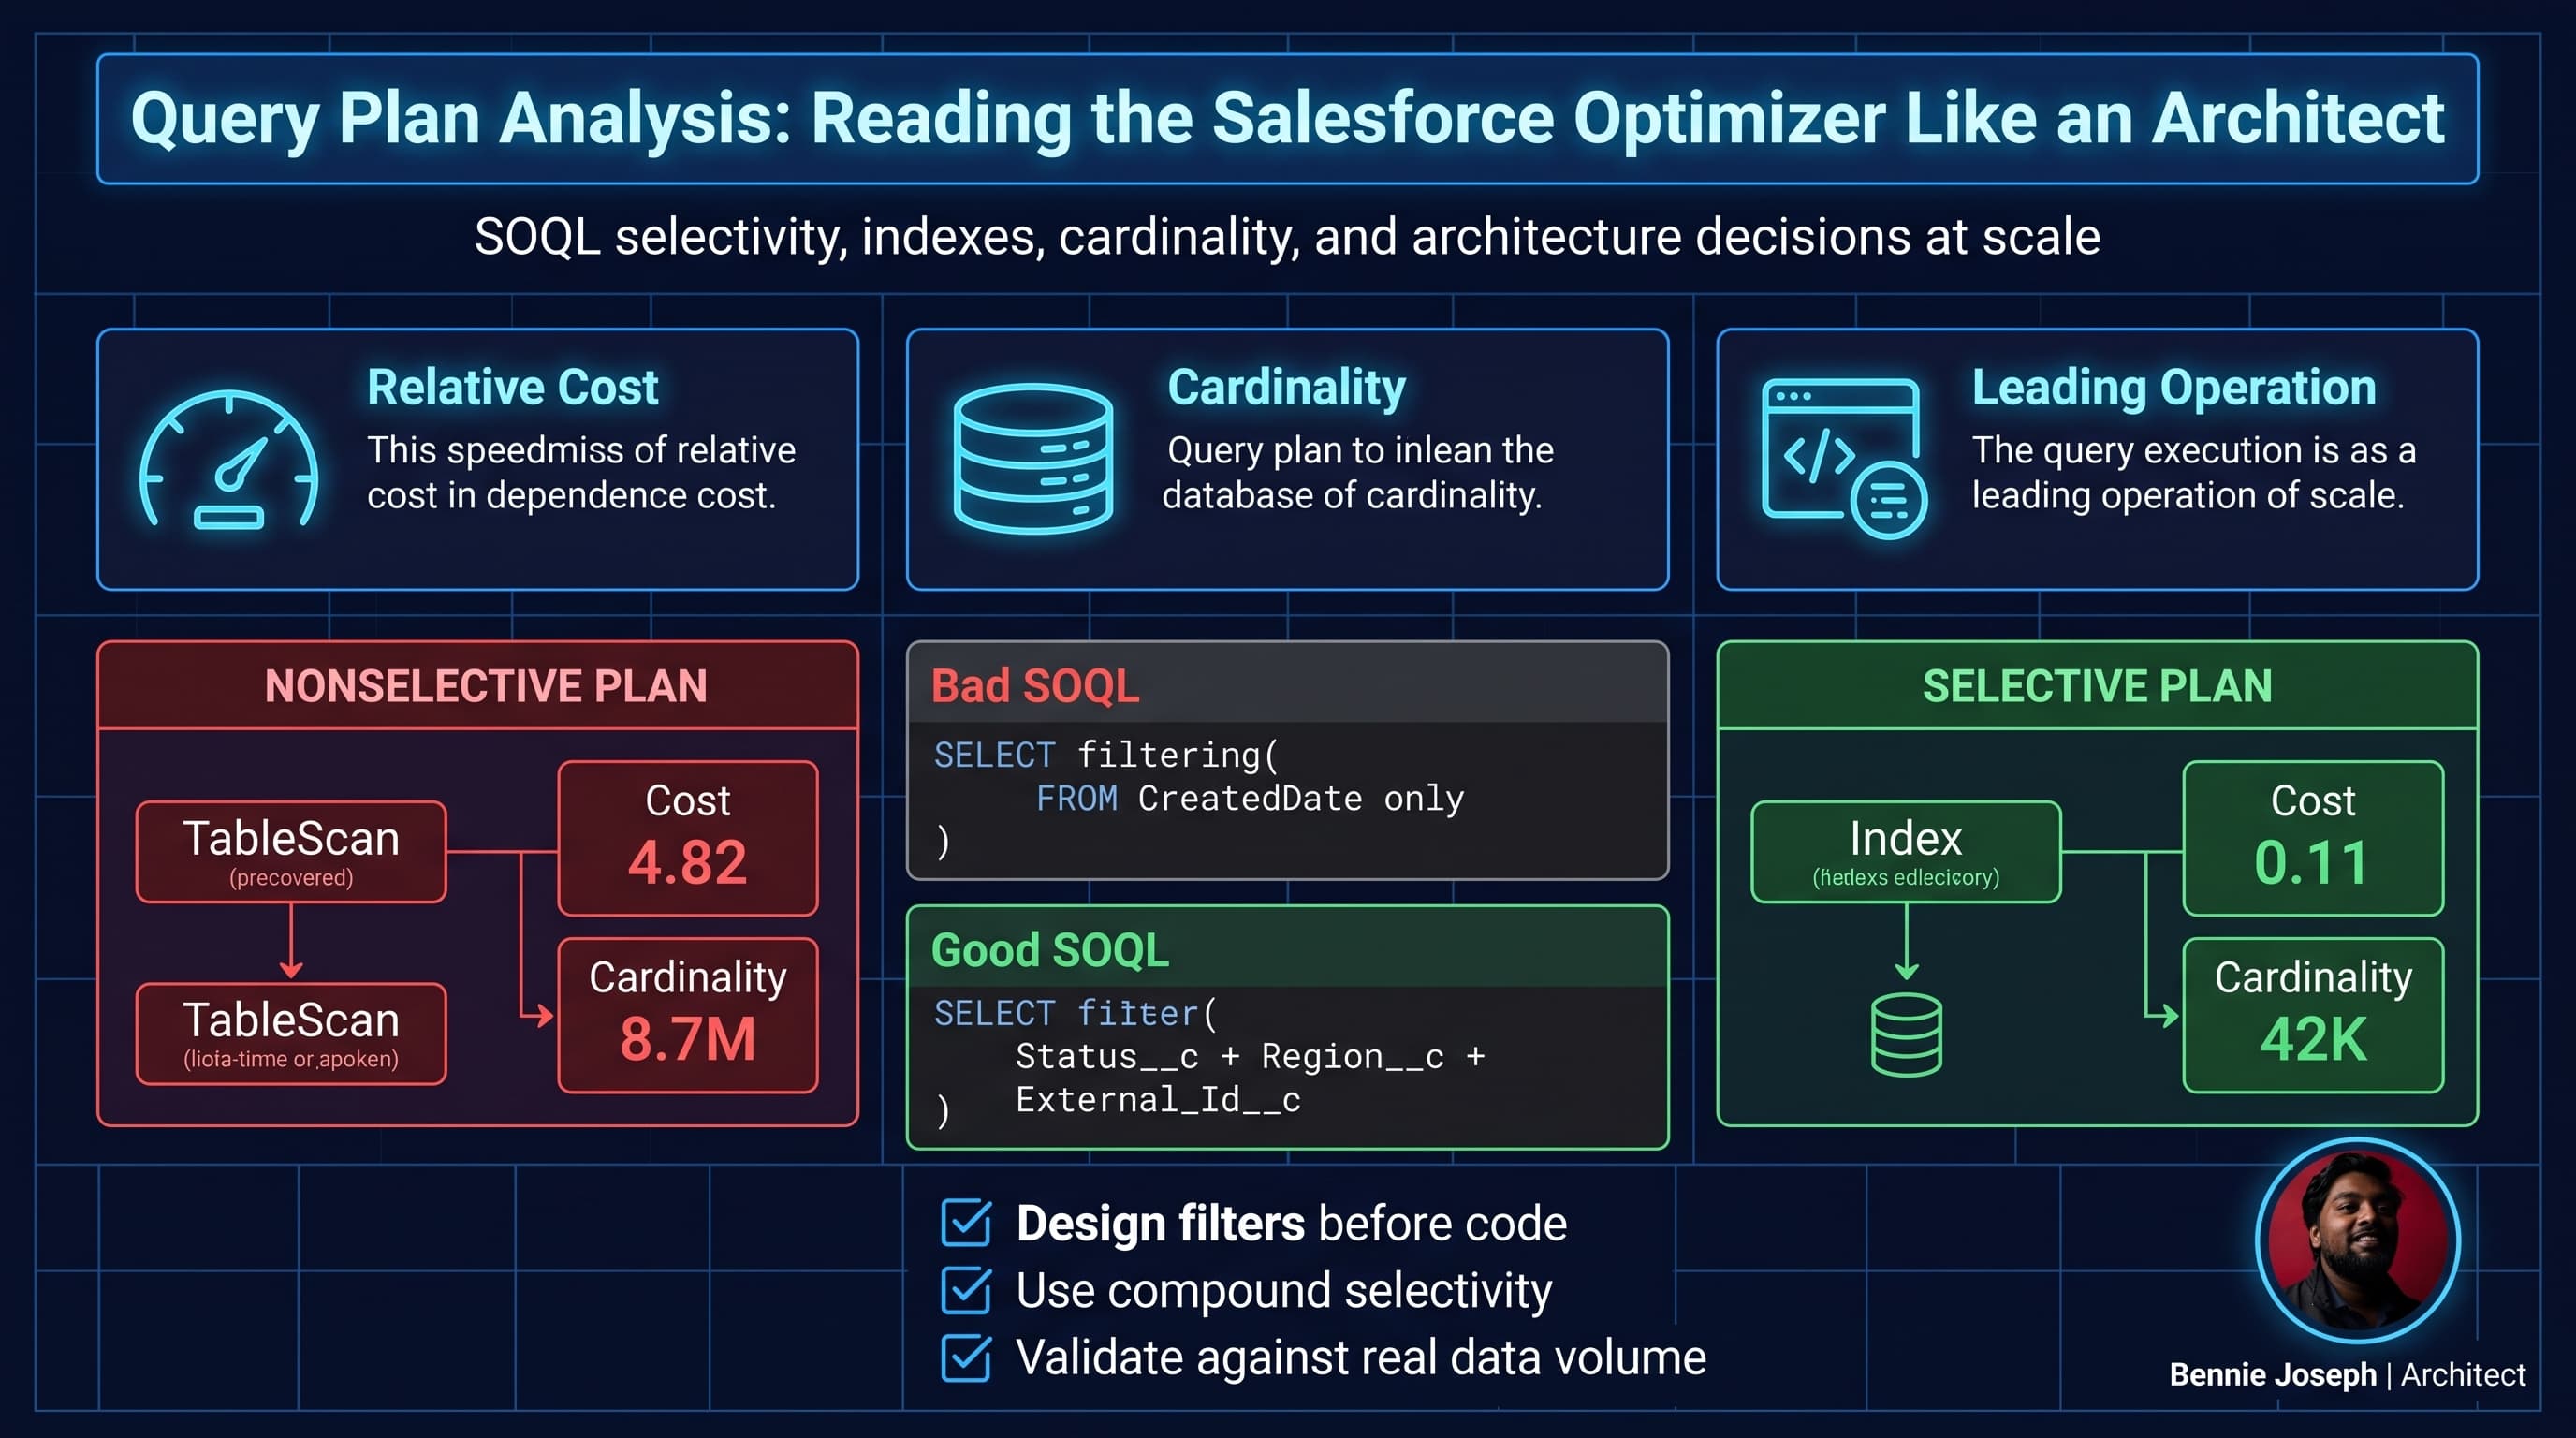
I treat query plans as architecture artifacts, not developer debugging tools.
That is the mindset shift most teams miss.
A slow SOQL query is rarely just “bad code.” It is usually a sign that the data model, indexing strategy, sharing model, archival policy, or access pattern was designed without enough respect for scale. The Salesforce optimizer is not trying to make your query fast because your Apex class looks clean. It is trying to choose the cheapest access path based on statistics, selectivity, indexes, sharing visibility, and table size.
If you do not know how to read that decision, you are guessing.
In large Salesforce orgs, guessing gets expensive fast. A query that behaves fine with 80,000 records can fall apart at 8 million. A report that runs in QA can time out in production. An Agentforce 2.0 action that retrieves customer records can become unreliable because the underlying SOQL is nonselective under real customer distribution. A batch job that worked during migration testing can hit query timeout once soft-deleted records, skew, and sharing rules show up.
This post is how I read the Salesforce optimizer when I am making architecture decisions around SOQL performance.
The Query Plan Is the Optimizer Showing Its Hand
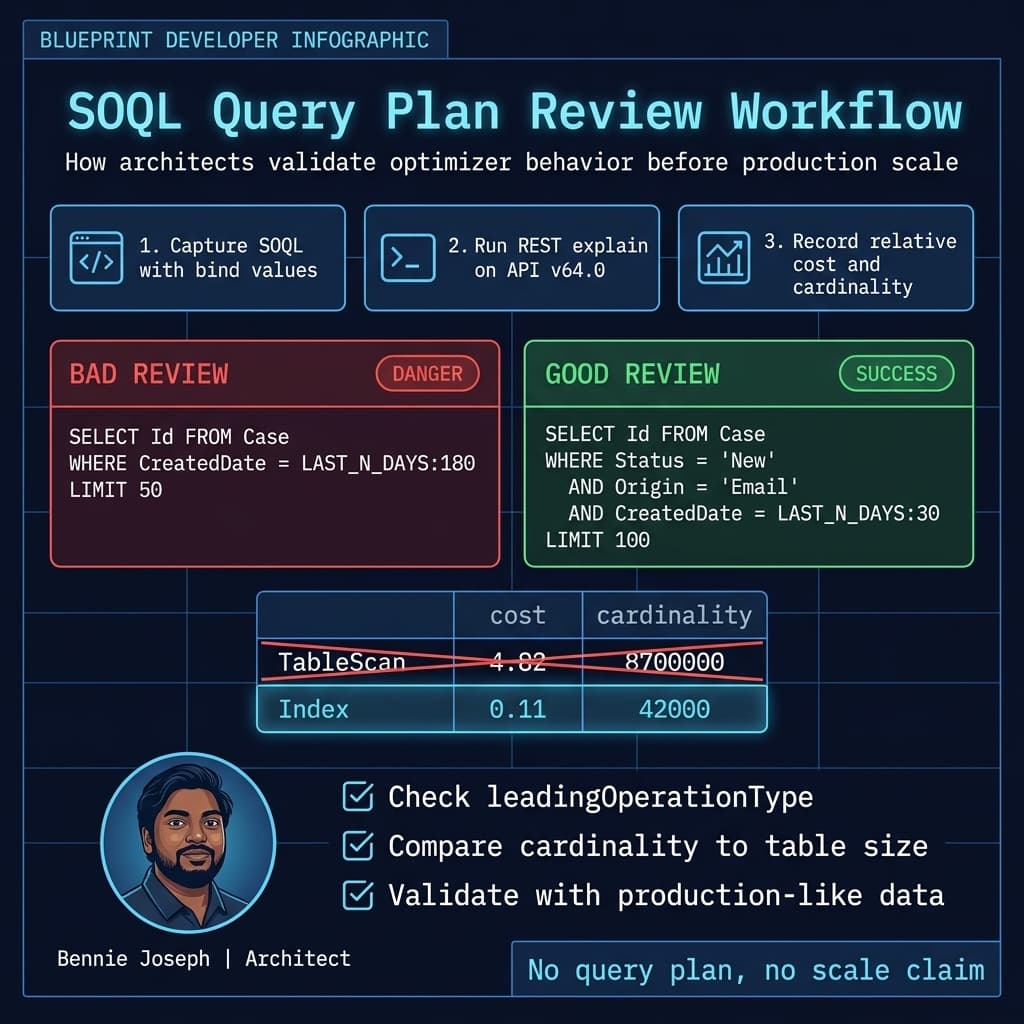
Salesforce exposes query plans through the Query Plan Tool, Developer Console, and REST API explain calls. I prefer using the API in serious analysis because I want repeatable evidence in pull requests, performance reviews, and architecture decision records.
At a high level, a query plan tells you:
- Which access path the optimizer is likely to use
- Whether the query is driven by an index or a table scan
- How many rows Salesforce expects to inspect
- How expensive the plan is relative to other options
- Which field or index is leading the query
- Whether the query is selective enough for large data volumes
The optimizer is cost-based. It does not simply say, “This field has an index, so I will use it.” Indexed fields can still be ignored if the filter is not selective enough. That surprises a lot of teams.
Here is the unpopular take: asking Salesforce Support for a custom index before understanding your query plan is premature. Sometimes you need the index. Sometimes your filter values are too common, your data distribution is broken, your query shape is wrong, or your object should have been partitioned logically through architecture decisions years earlier.
The Metrics I Actually Care About
When I inspect a query plan, I focus on five things.
1. Leading Operation Type
This is the first big signal.
Common values include:
IndexTableScanOther- sometimes operations tied to sharing or specific internal optimizations
If I see TableScan on a large object, I slow down immediately. A table scan is not always evil for small objects, but on high-volume objects it is a warning sign.
A table scan on 1,000 records is noise.
A table scan on 100,000 records is something to inspect.
A table scan on 10 million records is usually an incident waiting for a user, batch, integration, report, or agent action to trigger it.
2. Relative Cost
Relative cost is one of the most useful values, but also one of the most misunderstood. It is not milliseconds. It is not CPU time. It is a relative estimate the optimizer uses to compare available access paths.
As a practical rule, I want the selected plan cost under 1. Lower is better.
When I see costs like 0.02, 0.08, or 0.19, I am usually comfortable.
When I see 1.7, 4.5, or 12, I assume the query is not viable at scale until proven otherwise.
3. Cardinality
Cardinality is the estimated number of records matching the filter.
This is where architecture meets reality. If your query returns 650,000 records, it does not matter that your Apex method only needs 50. The optimizer has to reason about the filter, not your intention.
Bad pattern:
List<Case> cases = [
    SELECT Id, CaseNumber, Status, Priority
    FROM Case
    WHERE CreatedDate = LAST_N_DAYS:180
    ORDER BY CreatedDate DESC
    LIMIT 50
    WITH USER_MODE
];
Developers often assume LIMIT 50 makes this safe.
It does not necessarily make the query selective.
The optimizer still needs a plan to find the matching rows before returning 50. If LAST_N_DAYS:180 matches 6 million records, you have a problem even with a limit.
4. SObject Cardinality
This is the approximate total row count for the object. It tells me the denominator.
A filter matching 20,000 records behaves differently depending on whether the object has 30,000 total records or 30 million.
For custom indexes, the rough selectivity threshold is usually around:
- 10% of the first 1 million rows
- 5% after that
- capped around 333,333 targeted rows
For standard indexes, the rough threshold is usually around:
- 30% of the first 1 million rows
- 15% after that
- capped around 1 million targeted rows
Do not treat those numbers as a legal contract. Treat them as architectural guardrails.
5. Fields Used by the Plan
The optimizer may not use the field you expected.
You might filter on three fields:
WHERE Status__c = 'Open'
AND Region__c = 'EMEA'
AND CreatedDate = LAST_N_DAYS:30
But the plan may lead with Status__c, Region__c, CreatedDate, an existing compound index, or none of them. If Status__c = 'Open' matches 70% of the table, that field is not a good leading filter even if it is indexed.
Pulling Query Plans Through the API
For repeatable analysis, I use the Salesforce REST API explain parameter on API v64.0. I do this during performance investigations and before approving high-risk query patterns.
Here is a Python script I use as a baseline. It calls the explain endpoint and prints the plan fields I care about.
import os
import json
import urllib.parse
import requests

INSTANCE_URL = os.environ["SF_INSTANCE_URL"]
ACCESS_TOKEN = os.environ["SF_ACCESS_TOKEN"]
API_VERSION = "v64.0"

soql = """
SELECT Id, CaseNumber, Status, Priority, CreatedDate
FROM Case
WHERE Status = 'New'
AND Origin = 'Email'
AND CreatedDate = LAST_N_DAYS:30
ORDER BY CreatedDate DESC
LIMIT 100
"""

encoded_soql = urllib.parse.quote(" ".join(soql.split()))

url = f"{INSTANCE_URL}/services/data/{API_VERSION}/query/?explain={encoded_soql}"

response = requests.get(
    url,
    headers={
        "Authorization": f"Bearer {ACCESS_TOKEN}",
        "Content-Type": "application/json"
    },
    timeout=30
)

response.raise_for_status()
payload = response.json()

plans = payload.get("plans", [])

print(json.dumps(payload, indent=2))

print("\nQuery Plan Summary")
print("==================")

for plan in plans:
    print(f"Leading Operation : {plan.get('leadingOperationType')}")
    print(f"Cost              : {plan.get('relativeCost')}")
    print(f"Cardinality       : {plan.get('cardinality')}")
    print(f"SObject Rows      : {plan.get('sobjectCardinality')}")
    print(f"Fields            : {plan.get('fields')}")
    print(f"Notes             : {plan.get('notes')}")
    print("-" * 50)
I do not put this in production runtime. This is an engineering and architecture analysis tool.
In larger teams, I like storing the output in the pull request when a new selector query touches a large object. Not for every query. That becomes noise. But for Case, Task, Event, Opportunity, high-volume custom objects, integration log objects, and transaction records, I want proof.
The Enterprise Example: Case Search at Scale
One of the messier examples I worked through involved a Service Cloud implementation for a large enterprise support organization.
The object was Case, but the real issue was not Case itself. It was the way everyone accessed Case:
- Console search components
- Escalation dashboards
- Integration reconciliation jobs
- Customer portal pages
- Batch ownership reassignment
- Operational reports
- Agent-assist actions that retrieved recent customer issues
The production org had tens of millions of Case records, years of history, multiple support regions, complex sharing, and heavy email-to-case volume.
The original query behind one console component looked innocent:
public with sharing class RecentCaseFinder {
    @AuraEnabled(cacheable=true)
    public static List<Case> findRecentCases(Id accountId) {
        return [
            SELECT Id, CaseNumber, Subject, Status, Priority, CreatedDate
            FROM Case
            WHERE AccountId = :accountId
            AND CreatedDate = LAST_N_DAYS:365
            ORDER BY CreatedDate DESC
            LIMIT 25
            WITH USER_MODE
        ];
    }
}
For most accounts, it was fine.
For strategic enterprise accounts, it was not fine. Some parent accounts had thousands of related cases. Some account hierarchies were modeled inconsistently. Some cases were reparented during mergers. The business wanted the query to support both direct accounts and account family views.
Then someone tried to generalize it:
public with sharing class RecentCaseFinder {
    @AuraEnabled(cacheable=true)
    public static List<Case> findRecentCases(Set<Id> accountIds) {
        return [
            SELECT Id, CaseNumber, Subject, Status, Priority, CreatedDate
            FROM Case
            WHERE AccountId IN :accountIds
            AND CreatedDate = LAST_N_DAYS:365
            ORDER BY CreatedDate DESC
            LIMIT 25
            WITH USER_MODE
        ];
    }
}
This is where scale started pushing back.
For small account hierarchies, no issue. For large ones, the IN list grew, the date range was broad, and the optimizer could not always find a cheap path. The selected plan varied depending on data distribution.
The first bad architectural instinct was to add more caching.
Caching can reduce repeated pain. It does not fix a bad access pattern. If the cache misses during peak support hours, users still pay the price. If an Agentforce 2.0 action depends on the same data retrieval path, the agent inherits the unreliability.
We changed the access pattern instead.
The redesigned model introduced a support visibility object that precomputed the relationship between searchable customer scope and case identifiers for high-volume account families. We also narrowed the query by operational status and introduced archive rules for cases outside active support windows.
The runtime query became closer to this:
public with sharing class ActiveSupportCaseSelector {
    @AuraEnabled(cacheable=true)
    public static List<Case> findActiveCases(Id supportScopeId) {
        List<Support_Case_Index__c> indexRows = [
            SELECT Case__c
            FROM Support_Case_Index__c
            WHERE Support_Scope__c = :supportScopeId
            AND Is_Active_Window__c = true
            ORDER BY Last_Interaction_Date__c DESC
            LIMIT 100
            WITH USER_MODE
        ];

        Set<Id> caseIds = new Set<Id>();
        for (Support_Case_Index__c row : indexRows) {
            caseIds.add(row.Case__c);
        }

        if (caseIds.isEmpty()) {
            return new List<Case>();
        }

        return [
            SELECT Id, CaseNumber, Subject, Status, Priority, CreatedDate
            FROM Case
            WHERE Id IN :caseIds
            ORDER BY CreatedDate DESC
            LIMIT 25
            WITH USER_MODE
        ];
    }
}
Was this more architecture? Yes.
Was it worth it? Also yes.
We moved the expensive ambiguity out of the user request path. We stopped asking the optimizer to solve a broad business relationship problem at click time. The query plan became predictable because the lookup object was designed around the actual access pattern.
That is the architectural lesson: query performance is often won before the query is written.
Decision Matrix: Fixing Nonselective SOQL
When a query plan looks bad, teams jump to random fixes. I prefer a decision matrix because each option has operational consequences.
| Approach | Best When | Tradeoffs | Scale Behavior |
|---|---|---|---|
| Add or request an index | A stable, frequently used filter has good selectivity | Requires governance; not every field/value distribution qualifies | Strong at 100K and 10M if filter remains selective |
| Rewrite filters for compound selectivity | Multiple business filters together narrow the result set | Requires understanding real data distribution | Usually the best first move at enterprise scale |
| Add deterministic helper fields | Query logic depends on formulas, derived status, or complex business rules | Extra write-time maintenance; backfill required | Excellent if maintained consistently |
| Introduce a purpose-built index object | Access pattern spans hierarchies, many-to-many relationships, or active windows | More data model complexity; eventual consistency decisions | Often necessary at 10M+ for complex retrieval |
| Archive or partition data logically | Old records dominate table size and are rarely queried | Requires retention policy, compliance input, UX decisions | Essential when historical data distorts selectivity |
| Use async precomputation | User-facing query depends on expensive aggregation or relationship expansion | Staleness must be acceptable and visible | Strong for dashboards, agents, and console components |
| Cache results | Same expensive result is read repeatedly | Does not fix cache misses; invalidation complexity | Helpful but dangerous as the only solution |
| Denormalize selective fields | Parent or related-object filters cause inefficient joins or broad scans | Data duplication and sync logic | Effective when the read path matters more than write purity |
Here is my bias: if the access pattern is business-critical and high-volume, I would rather add explicit architecture than rely on accidental optimizer behavior.
A clean normalized data model that cannot answer the business query at scale is not clean. It is incomplete.
Why Indexed Fields Still Fail
A field being indexed is not enough. The optimizer cares about selectivity.
Imagine a custom object Order_Event__c with 10 million records.
SELECT Id, External_Order_Id__c, Event_Status__c
FROM Order_Event__c
WHERE Event_Status__c = 'Processed'
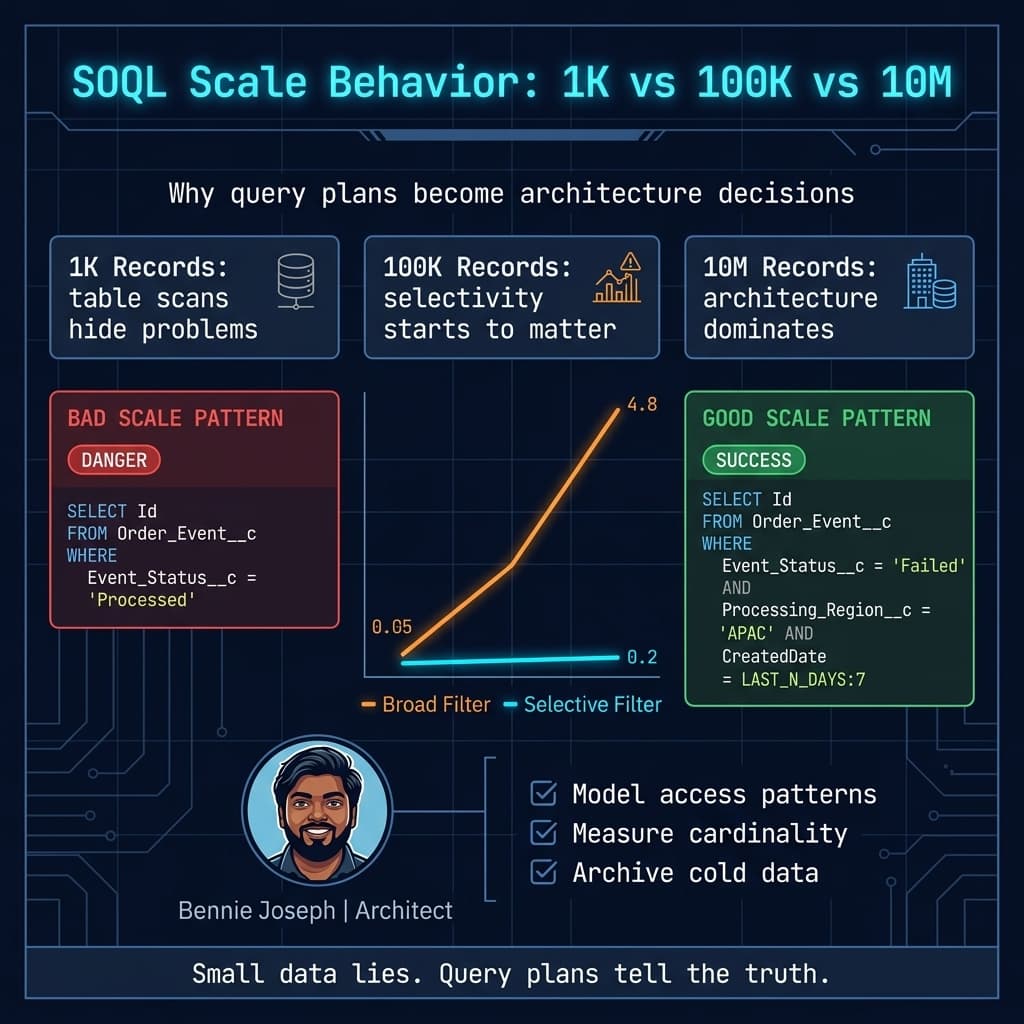
If 8.5 million rows are Processed, this filter is terrible. An index on Event_Status__c does not magically help. The optimizer may choose a table scan because using the index still points to most of the table.
Now compare this:
SELECT Id, External_Order_Id__c, Event_Status__c
FROM Order_Event__c
WHERE Event_Status__c = 'Failed'
AND Processing_Region__c = 'APAC'
AND CreatedDate = LAST_N_DAYS:7
If Failed is rare, APAC narrows further, and seven days of data is a small slice, the plan becomes much healthier.
In architecture reviews, I ask for value distribution, not just field names.
Bad question:
Is
Status__cindexed?
Better question:
What percentage of rows match each
Status__cvalue, and which values appear in our critical queries?
Even better:
What does the query plan show for the actual production-like filter values used by the highest-volume user journeys?
Formulas, Nulls, Negatives, and Other Optimizer Traps
Some query patterns repeatedly cause trouble.
Formula Fields
Filtering on formula fields can be problematic unless the formula is deterministic and eligible for indexing. Even then, I am cautious.
If a formula represents a critical query dimension, I often prefer a real stored field maintained at write time.
Example:
trigger CaseBeforeSave on Case (before insert, before update) {
    for (Case c : Trigger.new) {
        c.Active_Support_Window__c =
            c.Status != 'Closed' &&
            c.CreatedDate == null
                ? true
                : c.Status != 'Closed';
    }
}
That example is intentionally simple. In real implementations, I would usually move this logic into a domain service and handle date boundaries explicitly. The point is that stored, queryable state is often better than asking the optimizer to reason through business logic at read time.
Negative Filters
Queries like this are often weak:
SELECT Id
FROM Case
WHERE Status != 'Closed'
If most cases are not closed, this is broad. If most cases are closed, it still may not be as optimizer-friendly as an explicit positive filter.
Prefer:
SELECT Id
FROM Case
WHERE Status IN ('New', 'Working', 'Escalated')
Positive filters communicate intent and can improve selectivity.
Leading Wildcards
This is usually bad for selective search:
SELECT Id, Name
FROM Account
WHERE Name LIKE '%Global%'
A leading wildcard makes index usage difficult. For search-like requirements, consider SOSL, external search infrastructure, Data 360 retrieval patterns for unstructured content, or a purpose-built search service depending on the use case.
Null Filters
Null filtering can be tricky. If a field is sparsely populated, WHERE Some_Field__c = null may match a large portion of the table. Do not assume null means selective.
Large IN Clauses
IN :ids is not automatically bad. Querying by Id IN :ids is usually fine when the set is reasonable. But large dynamic sets against non-Id fields can create unstable plans, especially when the list is generated from another broad query.
Architecture at 1K, 100K, and 10M Records
Performance architecture is mostly about refusing to extrapolate from tiny data.
At 1K Records
At 1,000 records, nearly everything works.
A table scan is cheap. Broad date filters are cheap. Reports feel instant. Developers develop false confidence. This is why sandbox testing with unrealistic data volume is dangerous.
At this size, query plan analysis is still useful as a design habit, but not always necessary for every query.
At 100K Records
At 100,000 records, weak patterns begin to show.
You may see:
- Console components taking longer
- Reports slowing down with broad filters
- Batch jobs approaching timeout windows
- Sharing calculations affecting perceived query speed
- Unstable performance depending on filter values
This is where I start checking query plans for critical paths. If a query is on a home page, console utility, integration endpoint, batch start method, or agent action, I want to know its plan.
At 10M Records
At 10 million records, architecture decisions dominate.
You need to think about:
- Selective access paths
- Archival strategy
- Ownership and sharing skew
- Lookup skew
- Skinny tables only when appropriate and supported
- Custom indexes with real selectivity
- Async precomputation
- Data lifecycle management
- Query behavior under different business segments
- Operational dashboards separated from historical analytics
At this scale, the optimizer is not your safety net. It is your feedback mechanism.
If the query plan says your cost is high and cardinality is huge, believe it.
Query Plan Analysis for Apex Selectors
I like selector classes because they centralize query behavior. But selector classes do not automatically make SOQL efficient. They just give you one place to be disciplined.
Here is a simplified selector pattern I would actually tolerate in an enterprise org:
public with sharing class OrderEventSelector {
    public class SearchCriteria {
        @AuraEnabled public String status;
        @AuraEnabled public String region;
        @AuraEnabled public Datetime startDate;
        @AuraEnabled public Datetime endDate;
        @AuraEnabled public String externalOrderId;
    }

    @AuraEnabled(cacheable=true)
    public static List<Order_Event__c> search(SearchCriteria criteria) {
        validateCriteria(criteria);

        return [
            SELECT Id,
                   External_Order_Id__c,
                   Event_Status__c,
                   Processing_Region__c,
                   CreatedDate,
                   Error_Code__c
            FROM Order_Event__c
            WHERE Event_Status__c = :criteria.status
            AND Processing_Region__c = :criteria.region
            AND CreatedDate >= :criteria.startDate
            AND CreatedDate <= :criteria.endDate
            ORDER BY CreatedDate DESC
            LIMIT 200
            WITH USER_MODE
        ];
    }

    private static void validateCriteria(SearchCriteria criteria) {
        if (criteria == null) {
            throw new AuraHandledException('Search criteria is required.');
        }

        if (String.isBlank(criteria.status)) {
            throw new AuraHandledException('Status is required for selective search.');
        }

        if (String.isBlank(criteria.region)) {
            throw new AuraHandledException('Region is required for selective search.');
        }

        if (criteria.startDate == null || criteria.endDate == null) {
            throw new AuraHandledException('Date range is required.');
        }

        Integer days = criteria.startDate.date().daysBetween(criteria.endDate.date());
        if (days > 31) {
            throw new AuraHandledException('Date range cannot exceed 31 days.');
        }
    }
}
Notice what this code does architecturally:
- It prevents broad searches.
- It requires selective dimensions.
- It caps date range.
- It uses user-mode data access.
- It makes the performance contract explicit.
Some teams dislike this because users want flexible search.
I get it. But “flexible search” over 10 million records is not a requirement. It is a negotiation. If the business needs broad discovery, build a search experience, analytics experience, or async export flow. Do not hide an unbounded table scan behind a pretty Lightning Web Component.
With LWC native state management GA in Summer ’26, client-side state patterns are cleaner, but that does not change the server-side truth: a well-managed UI state cannot rescue a nonselective query.
Query Plans and Agentforce 2.0 Actions
Agentforce 2.0 makes this more important, not less.
When I expose Apex actions, flows, APIs, or data retrieval capabilities to agents, I assume the access pattern will be invoked in ways humans did not manually test. Multi-agent orchestration and custom reasoning steps can call tools repeatedly, combine filters dynamically, and surface edge cases.
If an agent action says, “Find recent failed order events for this customer,” the underlying SOQL must be constrained by architecture:
- Required customer or scope identifier
- Required status
- Bounded date range
- Maximum result count
- Clear fallback path for broad requests
- Observability around query volume and errors
I do not want an agent improvising its way into a 10-million-row object with optional filters.
This is where query plan analysis becomes part of agent tool design. Before I approve a retrieval action, I want to know the worst-case query shape. Not the happy path. The worst plausible request.
What I Put in an Architecture Decision Record
For high-risk SOQL, I document the decision. Not with pages of ceremony. Just enough so the next architect or senior engineer knows why the query was shaped this way.
My ADR usually includes:
- Object name and estimated row count
- Critical user journey or integration path
- SOQL query shape
- Required filters
- Query plan output
- Relative cost
- Cardinality
- Leading operation
- Index dependency
- Data distribution assumptions
- Archival assumptions
- Failure mode if volume doubles
Here is a practical example:
## Decision: Active order event retrieval requires status, region, and 31-day date window

Object: Order_Event__c
Current rows: 12.4M
Projected rows in 18 months: 31M
Critical path: Support console and Agentforce order investigation action

SOQL shape:
- Event_Status__c = required
- Processing_Region__c = required
- CreatedDate bounded to max 31 days
- LIMIT 200

Query plan:
- leadingOperationType: Index
- relativeCost: 0.13
- cardinality: 58,000
- sobjectCardinality: 12,400,000
- fields: Event_Status__c, Processing_Region__c, CreatedDate

Decision:
Do not allow unbounded status-only searches from synchronous UI or agent actions.
Use async export for broader investigation.
That is enough. It makes the performance contract explicit.
Do Not Ignore Soft-Deleted Data
Salesforce query planning can be affected by records in the Recycle Bin and records pending physical deletion. Teams often forget this after large migrations or cleanup projects.
If you delete 5 million records from a 10-million-row object, do not assume the optimizer immediately behaves like the object has 5 million rows. Soft-deleted records can still influence statistics until hard deletion and backend cleanup complete.
For large data remediation, I always ask:
- Are records soft-deleted or hard-deleted?
- Did we use Bulk API hard delete where appropriate?
- Has enough time passed for statistics to reflect the new distribution?
- Did we re-check query plans after cleanup?
- Did archival move data out of the transactional object or just mark it inactive?
Marking records as archived with a checkbox may help business logic. It does not reduce table size. Sometimes it improves selectivity if your active filters are strong. Sometimes it just adds another low-selectivity checkbox.
Indexes Are Architecture, Not Decorations
An index is a commitment.
When I request or design around an index, I want to know:
- Which critical queries depend on it?
- Is the filtered value distribution selective?
- Will the index still be selective after growth?
- Does the field have too many nulls?
- Is the field updated frequently?
- Is the index supporting user-facing, integration, batch, or agent workloads?
- What happens if business usage shifts?
Custom indexes can be incredibly valuable. But they should follow access patterns, not guesses.
I have seen teams index fields because they “might be useful.” That is not architecture. That is clutter.
I have also seen teams avoid denormalization on principle, then wonder why every critical query requires cross-object complexity and broad scans. Purity is not the goal. Reliable performance is.
My Practical Review Checklist
When a query touches a large or fast-growing object, I run through this checklist:
- What is the current row count?
- What is the projected row count in 12–24 months?
- Which filters are always required?
- Which filters are optional, and what happens when they are absent?
- What is the worst-case cardinality?
- Does
LIMIThide a broad filter? - Does
ORDER BYforce expensive work? - Are formula fields involved?
- Are negative filters involved?
- Are null filters involved?
- Are sharing rules adding complexity?
- Are soft-deleted records distorting table size?
- Does the query plan use an index?
- Is relative cost under control?
- Is this query used by UI, integration, batch, reports, or Agentforce actions?
- Is there an async or search-based alternative for broad access?
- Is the data lifecycle policy aligned with the query pattern?
The answer is rarely “make this one SOQL line faster.” The answer is usually a design decision.
The Architecture Principle
The Salesforce optimizer is very good at what it does, but it is not a magician.
It cannot make a nonselective business question selective. It cannot turn bad data distribution into a clean access path. It cannot compensate for a missing archive strategy forever. It cannot infer that your LIMIT 50 means the query is harmless. It cannot rescue every flexible search screen from its own requirements.
My rule is simple:
If a query is critical at scale, its selectivity must be designed, measured, and protected.
That means query plan analysis belongs in architecture reviews, not just debugging sessions after users complain.
The teams that scale well do not wait for query timeouts. They read the optimizer early, shape the data model around real access patterns, and document the tradeoffs.
TL;DR
- Salesforce query plan analysis is architecture work: read leading operation, relative cost, cardinality, and table size before trusting SOQL at scale.
- Indexed fields only help when filters are selective; design access patterns with required filters, bounded dates, archival, and sometimes purpose-built index objects.
- At 10M+ records, query performance is won through data architecture, not last-minute Apex cleanup.