Apex CPU Limit Errors: The Real Fix
If you searched for apex cpu limit error fix, you probably already know the error:
Apex CPU time limit exceeded
The annoying part is that Salesforce usually throws it after the damage is done. The transaction rolls back, the debug log is huge, and the business user just sees a failed save, failed import, failed approval, or failed Agentforce action.
Here’s the unpopular take: most CPU issues are not “Salesforce being slow.” They are self-inflicted architecture problems.
The real fix is not blindly moving code to Queueables. The real fix is reducing the amount of work done inside the transaction.
In May 2026, this matters even more because Salesforce orgs are no longer just triggers and Flows. A normal enterprise transaction can include Apex, record-triggered Flows, validation rules, duplicate rules, managed packages, Agentforce 2.0 custom actions, Data Cloud enrichment, and LWC-driven saves from screens using native state management. CPU is shared across the transaction. Your Apex may be only one part of the fire.
What the CPU limit actually means
Apex CPU time is the amount of server processing time Salesforce spends executing logic in one transaction.
The common limits are:
- Synchronous transaction: 10,000 ms CPU
- Asynchronous transaction: 60,000 ms CPU
Database wait time is generally not counted as CPU, but the code around it is. Iterating records, building objects, serializing JSON, running trigger frameworks, executing Flow logic, evaluating formulas, and invoking reusable service layers all consume CPU.
A bad mental model is:
“My SOQL is slow, so I hit CPU.”
Sometimes. But more often:
“My query returned too much data, and my Apex/Flow spent too much CPU processing it.”
That distinction matters.
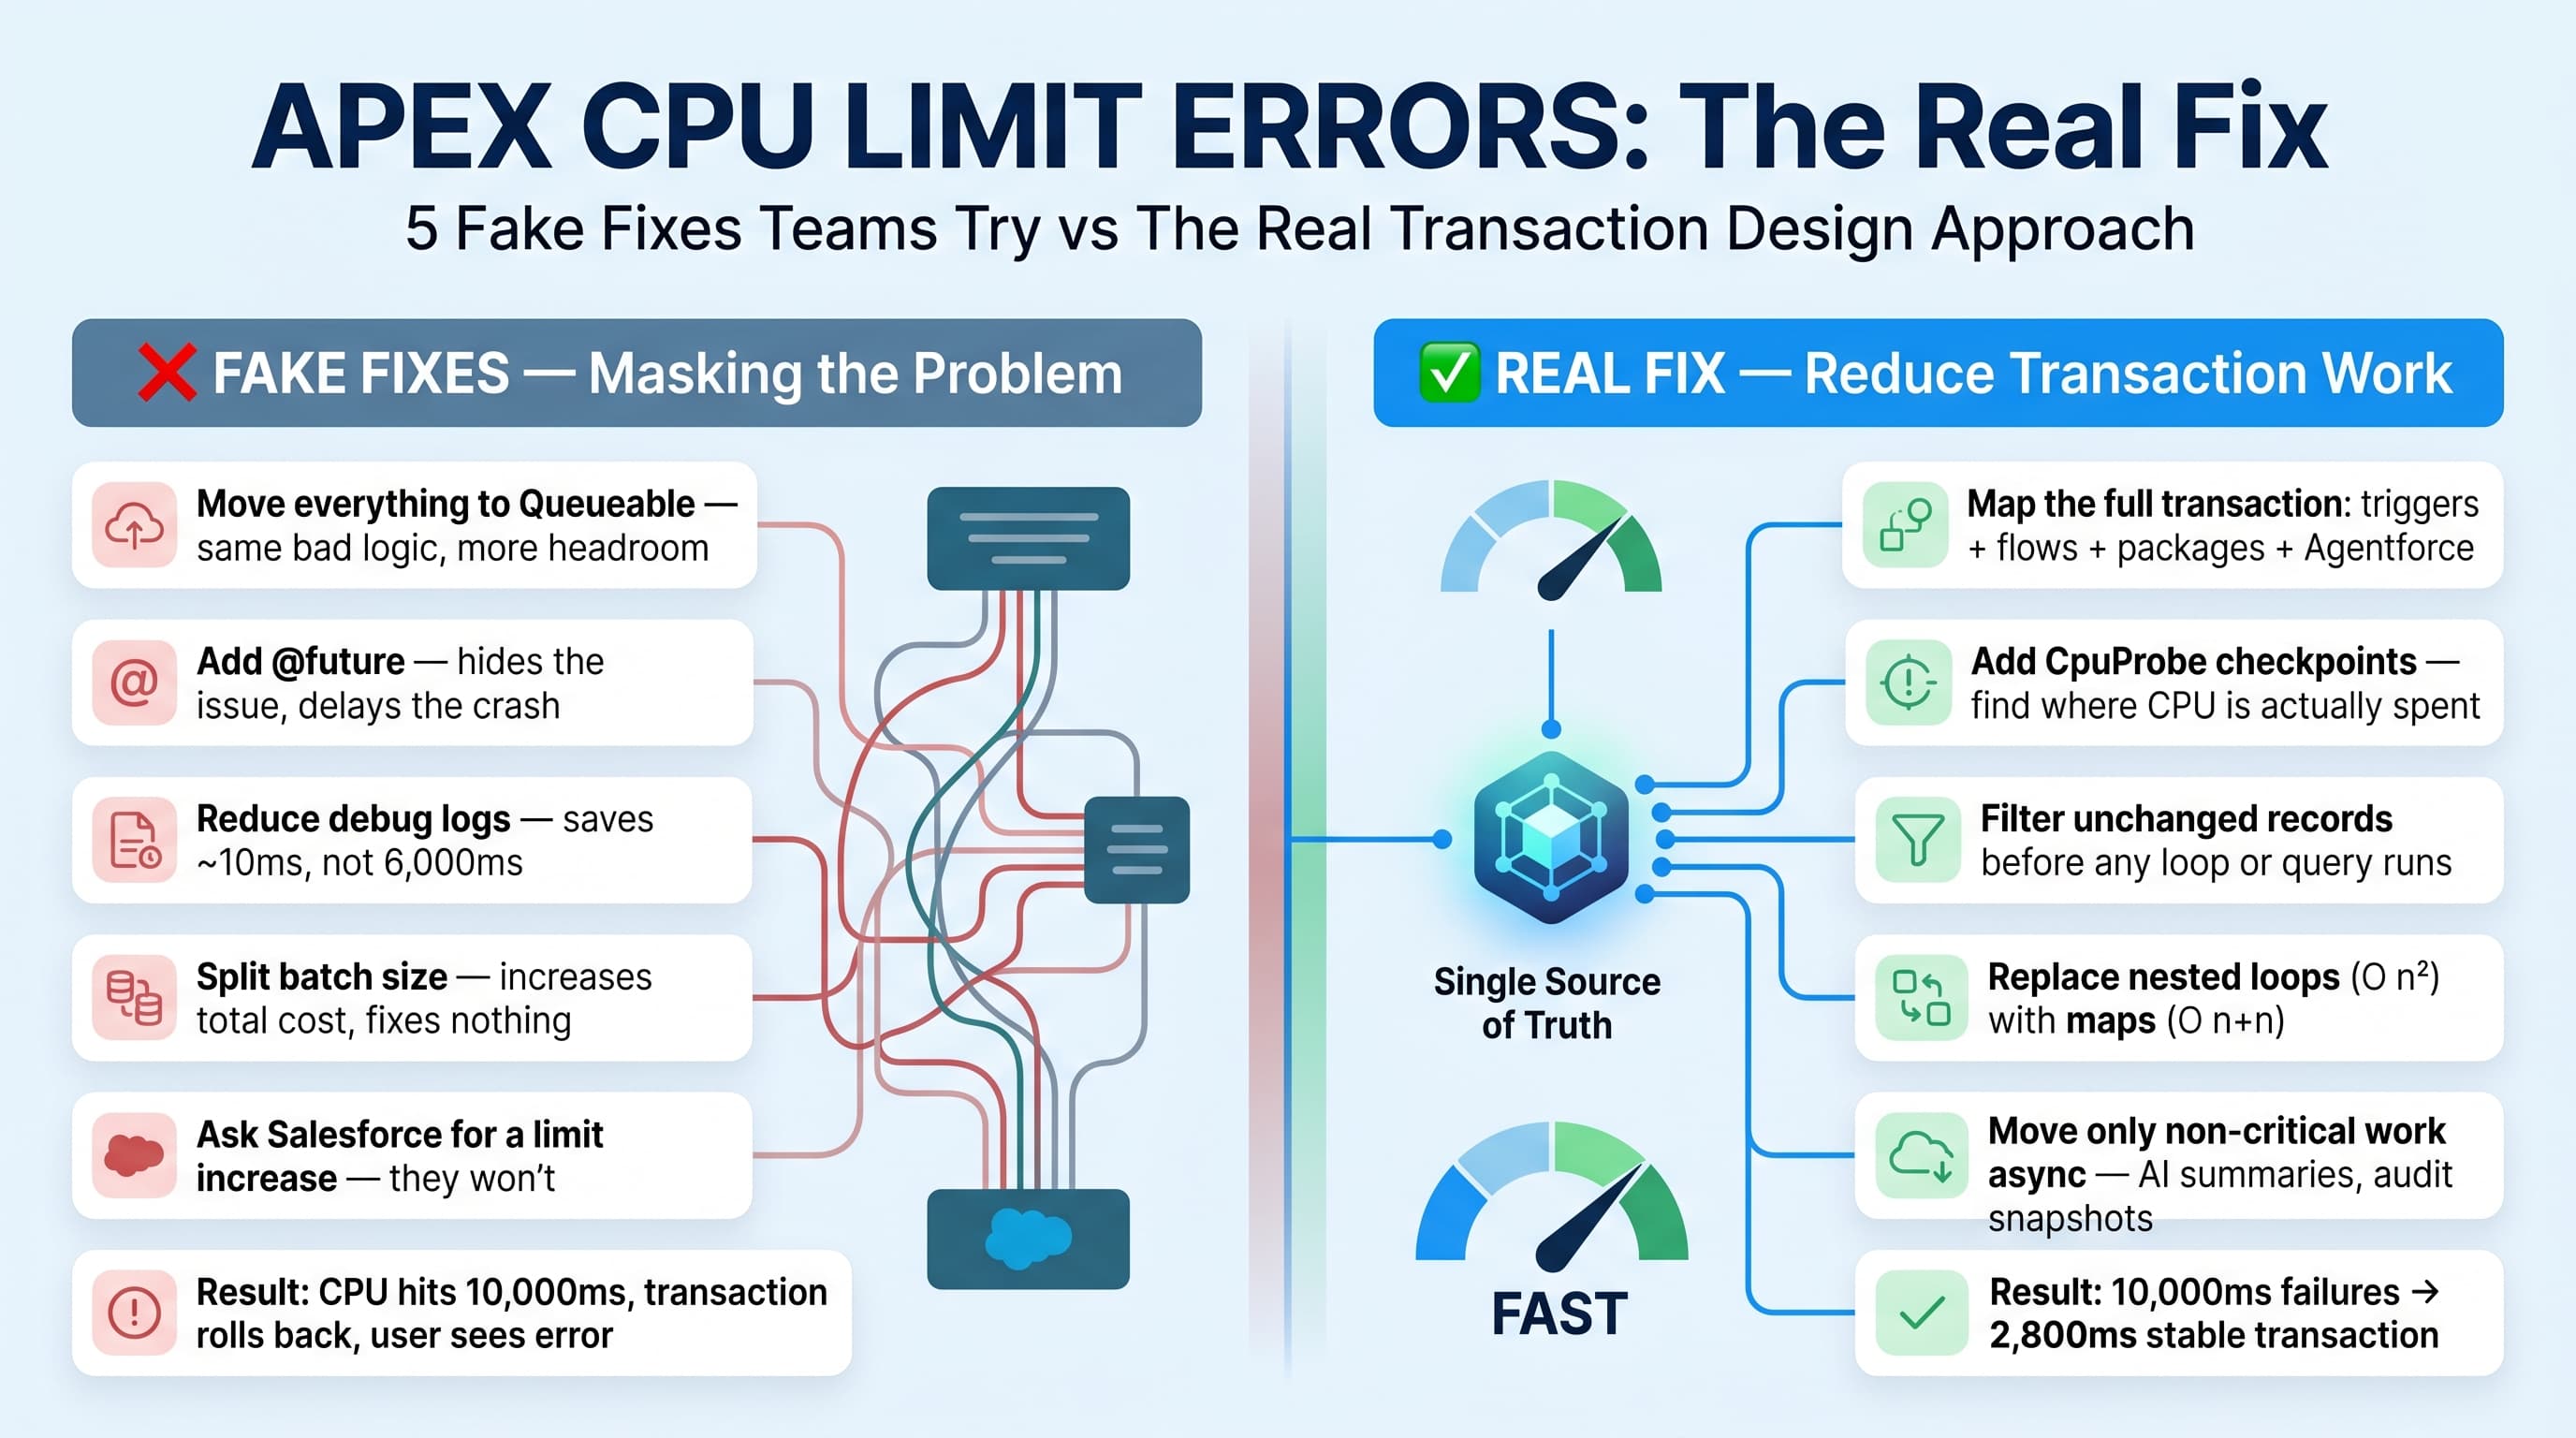
The fake fixes I see too often
When a team gets CPU errors, I usually see one of these reactions:
- “Move it to a Queueable.”
- “Add
@future.” - “Reduce debug logs.”
- “Split the batch size.”
- “Ask Salesforce for a limit increase.”
Some of these help in specific cases. None of them are the real fix.
Moving bad logic to async gives you more CPU headroom, but it does not make the logic efficient. Splitting batch size hides the symptom and increases total processing time. Removing debug statements helps only when logging is excessive. And Salesforce is not going to solve poor transaction design with a magic limit increase.
The real fix is to profile the transaction, find the repeated work, and remove it.
Start with transaction mapping, not code changes
Before I change code, I map the transaction.
For a failing Account update, I want to know:
- Which trigger handlers run?
- Which Flows run?
- Which managed packages run?
- Which rollups or recalculations run?
- Which validation and duplicate rules run?
- Which async jobs are enqueued?
- Whether Agentforce 2.0 is calling an Apex action in the same business process
- Whether the LWC is saving one record or accidentally saving many records
This is not bureaucracy. It prevents random fixes.
In one enterprise service project, the team blamed an Account trigger for CPU errors during case escalation. The trigger was ugly, but it was not the main problem. The real issue was a record-triggered Flow that updated related Cases, which fired Case triggers, which recalculated entitlements, which updated the Account again. The Account trigger was just where the transaction finally died.
If we had started by “optimizing the trigger,” we would have wasted days.
Add CPU checkpoints in the right places
I do not leave CPU logging everywhere forever, but I absolutely add checkpoints while diagnosing.
Here is a simple Apex utility I use during performance work:
public class CpuProbe {
    private static Integer lastCpu = Limits.getCpuTime();

    public static void mark(String label) {
        Integer current = Limits.getCpuTime();
        Integer delta = current - lastCpu;

        System.debug(LoggingLevel.WARN,
            'CPU_PROBE | ' + label +
            ' | deltaMs=' + delta +
            ' | totalMs=' + current +
            ' | limitMs=' + Limits.getLimitCpuTime()
        );

        lastCpu = current;
    }
}
Then I place it around service boundaries, not every line:
public with sharing class AccountLifecycleService {
    public static void processAfterUpdate(
        List<Account> newList,
        Map<Id, Account> oldMap
    ) {
        CpuProbe.mark('AccountLifecycleService.start');

        List<Account> changedAccounts = getAccountsWithRelevantChanges(newList, oldMap);
        CpuProbe.mark('filtered relevant Account changes');

        Map<Id, List<Case>> casesByAccountId = loadOpenCases(changedAccounts);
        CpuProbe.mark('loaded open Cases');

        applyEscalationRules(changedAccounts, casesByAccountId);
        CpuProbe.mark('applied escalation rules');

        updateCases(casesByAccountId);
        CpuProbe.mark('updated Cases');
    }

    private static List<Account> getAccountsWithRelevantChanges(
        List<Account> newList,
        Map<Id, Account> oldMap
    ) {
        List<Account> result = new List<Account>();

        for (Account acc : newList) {
            Account oldAcc = oldMap.get(acc.Id);

            if (acc.Tier__c != oldAcc.Tier__c ||
                acc.SLA_Level__c != oldAcc.SLA_Level__c ||
                acc.OwnerId != oldAcc.OwnerId) {
                result.add(acc);
            }
        }

        return result;
    }

    private static Map<Id, List<Case>> loadOpenCases(List<Account> accounts) {
        Set<Id> accountIds = new Map<Id, Account>(accounts).keySet();
        Map<Id, List<Case>> casesByAccountId = new Map<Id, List<Case>>();

        if (accountIds.isEmpty()) {
            return casesByAccountId;
        }

        for (Case c : [
            SELECT Id, AccountId, Priority, Status, OwnerId
            FROM Case
            WHERE AccountId IN :accountIds
            AND IsClosed = false
        ]) {
            if (!casesByAccountId.containsKey(c.AccountId)) {
                casesByAccountId.put(c.AccountId, new List<Case>());
            }
            casesByAccountId.get(c.AccountId).add(c);
        }

        return casesByAccountId;
    }

    private static void applyEscalationRules(
        List<Account> accounts,
        Map<Id, List<Case>> casesByAccountId
    ) {
        for (Account acc : accounts) {
            List<Case> relatedCases = casesByAccountId.get(acc.Id);

            if (relatedCases == null) {
                continue;
            }

            for (Case c : relatedCases) {
                if (acc.Tier__c == 'Platinum' && c.Priority != 'High') {
                    c.Priority = 'High';
                }
            }
        }
    }

    private static void updateCases(Map<Id, List<Case>> casesByAccountId) {
        List<Case> casesToUpdate = new List<Case>();

        for (List<Case> groupedCases : casesByAccountId.values()) {
            casesToUpdate.addAll(groupedCases);
        }

        if (!casesToUpdate.isEmpty()) {
            update casesToUpdate;
        }
    }
}
This tells me where CPU is being spent. I want evidence, not vibes.
The most common Apex CPU killer: nested loops
The classic CPU killer is still nested loops over records.
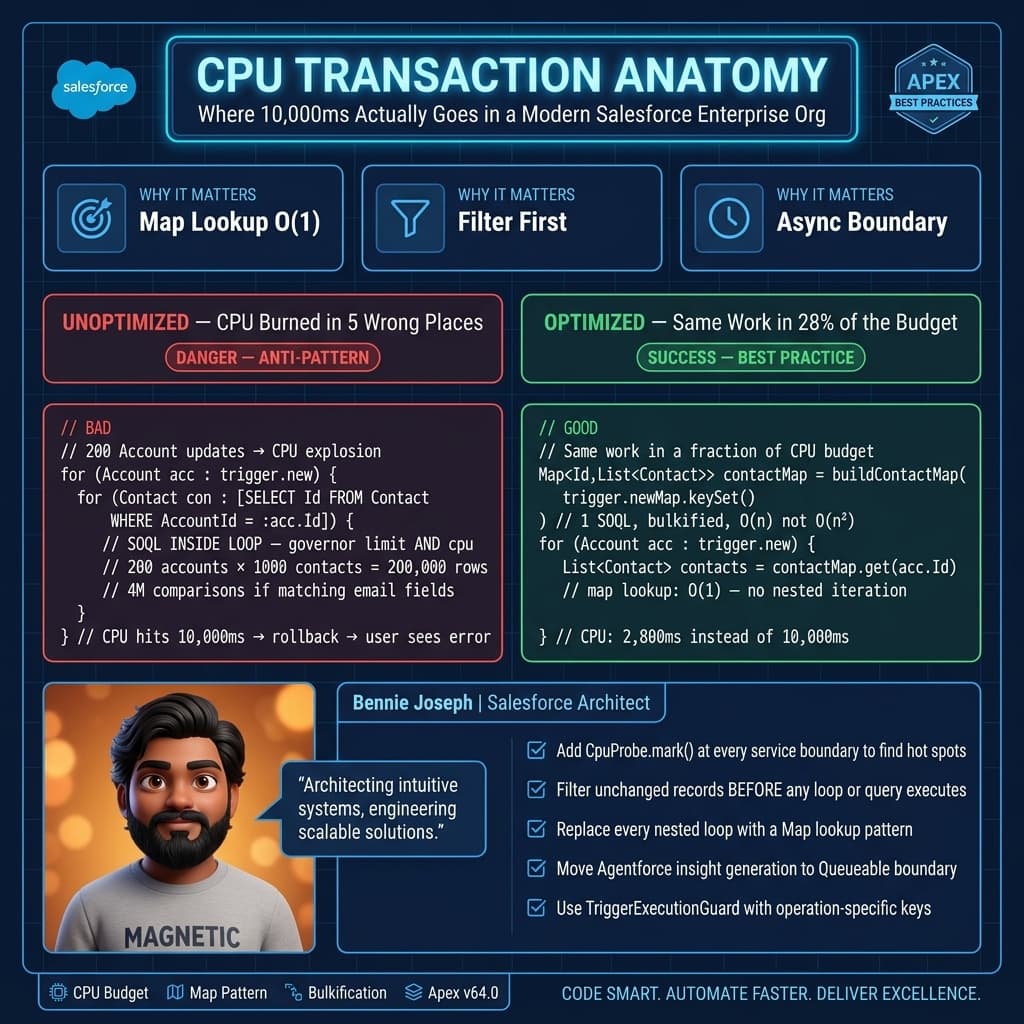
Bad code usually looks harmless in testing because developers test with 5 records. Then a data load hits 200 records, each with 300 related records, and the transaction explodes.
Bad pattern:
public class BadAccountMatcher {
    public static void matchContactsToAccounts(List<Account> accounts, List<Contact> contacts) {
        for (Account acc : accounts) {
            for (Contact con : contacts) {
                if (con.AccountId == acc.Id && con.Email != null) {
                    acc.Primary_Email__c = con.Email;
                }
            }
        }
    }
}
If there are 200 Accounts and 20,000 Contacts, that is 4,000,000 comparisons.
The fix is boring and effective: use a map.
public class AccountMatcher {
    public static void matchContactsToAccounts(List<Account> accounts, List<Contact> contacts) {
        Map<Id, Contact> firstContactByAccountId = new Map<Id, Contact>();

        for (Contact con : contacts) {
            if (con.AccountId == null || con.Email == null) {
                continue;
            }

            if (!firstContactByAccountId.containsKey(con.AccountId)) {
                firstContactByAccountId.put(con.AccountId, con);
            }
        }

        for (Account acc : accounts) {
            Contact matchedContact = firstContactByAccountId.get(acc.Id);

            if (matchedContact != null) {
                acc.Primary_Email__c = matchedContact.Email;
            }
        }
    }
}
This changes the complexity from accounts * contacts to accounts + contacts.
That is not a micro-optimization. That is the difference between a working enterprise org and a failed deployment.
Filter before you query, and filter after you query
One mistake I see in trigger frameworks is processing every record every time.
If a trigger runs after update, and only 8 of 200 records have meaningful changes, why process all 200?
Use change detection early.
public class OpportunityTriggerSelector {
    public static List<Opportunity> getRevenueRelevantChanges(
        List<Opportunity> newList,
        Map<Id, Opportunity> oldMap
    ) {
        List<Opportunity> changed = new List<Opportunity>();

        for (Opportunity opp : newList) {
            Opportunity oldOpp = oldMap.get(opp.Id);

            Boolean amountChanged = opp.Amount != oldOpp.Amount;
            Boolean stageChanged = opp.StageName != oldOpp.StageName;
            Boolean closeDateChanged = opp.CloseDate != oldOpp.CloseDate;

            if (amountChanged || stageChanged || closeDateChanged) {
                changed.add(opp);
            }
        }

        return changed;
    }
}
Then query only what you need.
public with sharing class OpportunityRevenueService {
    public static void recalculateForecasts(
        List<Opportunity> newList,
        Map<Id, Opportunity> oldMap
    ) {
        List<Opportunity> changedOpps =
            OpportunityTriggerSelector.getRevenueRelevantChanges(newList, oldMap);

        if (changedOpps.isEmpty()) {
            return;
        }

        Set<Id> accountIds = new Set<Id>();

        for (Opportunity opp : changedOpps) {
            if (opp.AccountId != null) {
                accountIds.add(opp.AccountId);
            }
        }

        List<Account> accounts = [
            SELECT Id, AnnualRevenue, Forecast_Category__c
            FROM Account
            WHERE Id IN :accountIds
        ];

        // Recalculate only for impacted Accounts.
        ForecastCalculator.recalculate(accounts, changedOpps);
    }
}
Apex CPU limit errors often happen because the code treats every update like a full recalculation event.
That is lazy design.
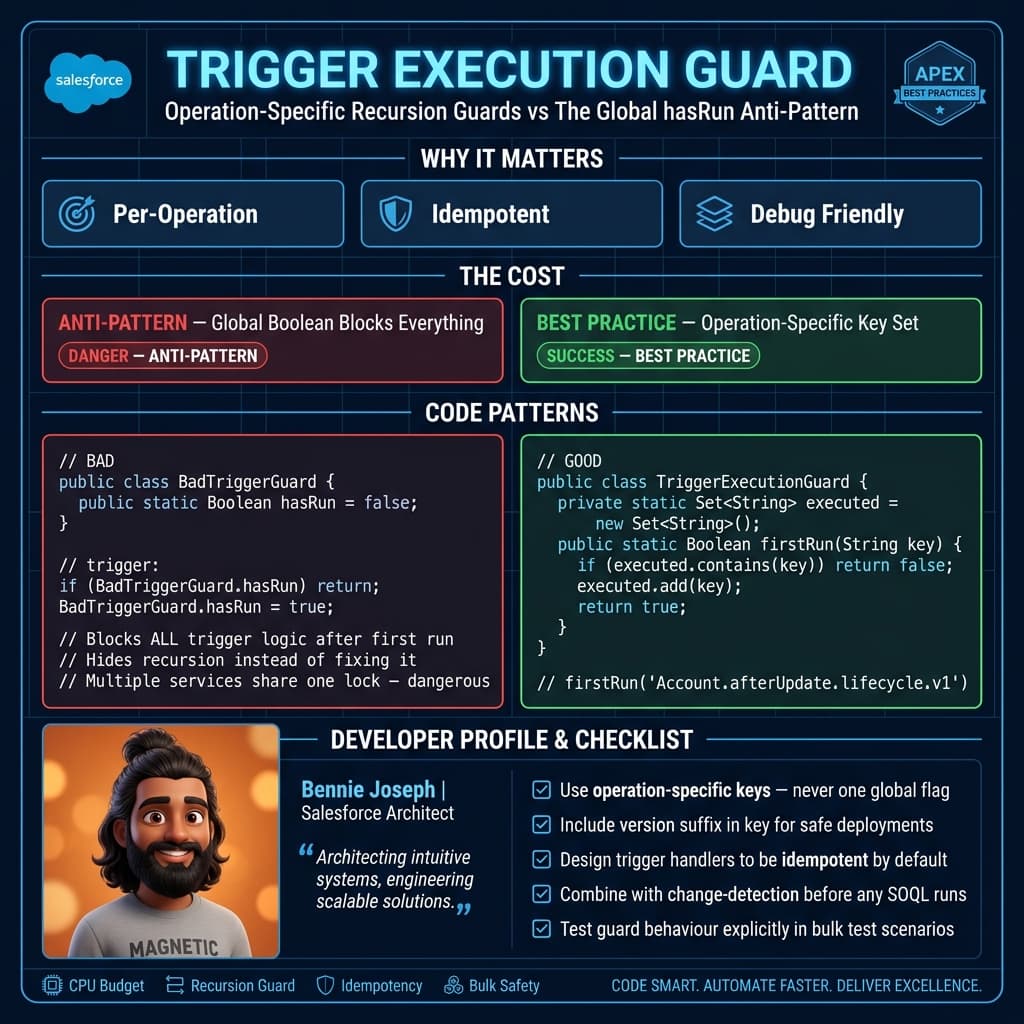
Recursion guards must be transaction-aware
Bad recursion guards are another CPU trap.
This is common:
public class BadTriggerGuard {
    public static Boolean hasRun = false;
}
Then the trigger does this:
if (BadTriggerGuard.hasRun) {
    return;
}
BadTriggerGuard.hasRun = true;
This can prevent legitimate chunks of work in the same transaction. It can also hide design problems instead of fixing them.
I prefer operation-specific guards.
public class TriggerExecutionGuard {
    private static Set<String> executedKeys = new Set<String>();

    public static Boolean firstRun(String operationKey) {
        if (executedKeys.contains(operationKey)) {
            return false;
        }

        executedKeys.add(operationKey);
        return true;
    }
}
Usage:
trigger AccountTrigger on Account (after update) {
    if (Trigger.isAfter && Trigger.isUpdate) {
        if (!TriggerExecutionGuard.firstRun('Account.afterUpdate.lifecycle.v1')) {
            return;
        }

        AccountLifecycleService.processAfterUpdate(Trigger.new, Trigger.oldMap);
    }
}
This is not perfect for every case, but it is much better than a global hasRun flag.
For complex enterprise orgs, I also design handlers to be idempotent. If the same logic runs twice, it should detect that no further work is required.
Real enterprise example: service escalation meltdown
A large service organization I worked with had intermittent CPU failures when support managers updated high-value Accounts.
The transaction looked simple:
- Manager updates Account tier.
- Account trigger updates open Cases.
- Case trigger recalculates SLA fields.
- Flow assigns entitlement milestones.
- Managed package automation updates routing fields.
- Agentforce 2.0 service action summarized customer risk and wrote back an insight record.
The failure appeared in the Account trigger, so everyone blamed Apex.
After profiling, the real issues were:
- The Account handler processed all Accounts, even when tier did not change.
- The Case handler queried all open Cases for the Account, including low-priority records that did not need recalculation.
- The Flow updated Cases even when values were unchanged.
- The Agentforce custom action wrote an insight record during the same user transaction.
- A nested loop compared every Case to every entitlement rule.
The fix was not one thing.
We changed the transaction design:
- Account trigger filtered only tier/SLA/owner changes.
- Case query filtered by
IsClosed = falseand relevant statuses. - Entitlement rule matching moved to maps by region and SLA level.
- Flow update elements were guarded with decision checks.
- Agentforce 2.0 insight generation moved to a Queueable boundary because the user did not need that write synchronously.
- The LWC save path was changed to send only dirty records, using native state management instead of rebuilding the entire editable table payload.
The CPU dropped from frequent 10,000 ms failures to roughly 2,800–4,000 ms for the same business operation.
No magic. Just less waste.
When async is the right fix
Async is valid when the work does not need to complete before the user gets control back.
Good candidates:
- AI summarization
- External enrichment
- Large recalculations
- Non-critical rollups
- Notification preparation
- Audit snapshots
- Data Cloud vector indexing follow-up work
Bad candidates:
- Required validation
- Required field updates needed immediately on the page
- Security checks
- Logic that determines whether the transaction should commit
Here is a clean Queueable boundary:
public class AccountRiskInsightJob implements Queueable {
    private Set<Id> accountIds;

    public AccountRiskInsightJob(Set<Id> accountIds) {
        this.accountIds = accountIds == null ? new Set<Id>() : accountIds.clone();
    }

    public void execute(QueueableContext context) {
        if (accountIds.isEmpty()) {
            return;
        }

        List<Account> accounts = [
            SELECT Id, Name, Tier__c, SLA_Level__c
            FROM Account
            WHERE Id IN :accountIds
        ];

        List<Account_Risk_Insight__c> insights = new List<Account_Risk_Insight__c>();

        for (Account acc : accounts) {
            insights.add(new Account_Risk_Insight__c(
                Account__c = acc.Id,
                Summary__c = 'Risk recalculation queued for ' + acc.Name,
                Source__c = 'Queueable'
            ));
        }

        if (!insights.isEmpty()) {
            insert insights;
        }
    }
}
And enqueue it only after filtering meaningful changes:
public class AccountAsyncDispatcher {
    public static void enqueueRiskInsightRefresh(
        List<Account> newList,
        Map<Id, Account> oldMap
    ) {
        Set<Id> accountIds = new Set<Id>();

        for (Account acc : newList) {
            Account oldAcc = oldMap.get(acc.Id);

            if (acc.Tier__c != oldAcc.Tier__c ||
                acc.SLA_Level__c != oldAcc.SLA_Level__c) {
                accountIds.add(acc.Id);
            }
        }

        if (!accountIds.isEmpty()) {
            System.enqueueJob(new AccountRiskInsightJob(accountIds));
        }
    }
}
Notice the pattern: I still filtered first. Async is not a garbage dump.
Use tests to enforce CPU discipline
Most Apex tests assert outcomes. Good tests also protect performance behavior.
I do not usually assert exact CPU milliseconds because shared org conditions can make that brittle. But I do test scale shape: 200 records, realistic related data, and no accidental N+1 logic.
@IsTest
private class AccountLifecycleServiceTest {
    @IsTest
    static void handlesBulkAccountUpdatesWithinCpuBudget() {
        List<Account> accounts = new List<Account>();

        for (Integer i = 0; i < 200; i++) {
            accounts.add(new Account(
                Name = 'Enterprise Account ' + i,
                Tier__c = 'Gold',
                SLA_Level__c = 'Standard'
            ));
        }

        insert accounts;

        List<Case> cases = new List<Case>();

        for (Account acc : accounts) {
            for (Integer i = 0; i < 5; i++) {
                cases.add(new Case(
                    AccountId = acc.Id,
                    Status = 'New',
                    Origin = 'Phone',
                    Priority = 'Medium'
                ));
            }
        }

        insert cases;

        Map<Id, Account> oldMap = new Map<Id, Account>(
            [SELECT Id, Tier__c, SLA_Level__c, OwnerId FROM Account WHERE Id IN :accounts]
        );

        for (Account acc : accounts) {
            acc.Tier__c = 'Platinum';
        }

        Test.startTest();
        Integer startCpu = Limits.getCpuTime();

        AccountLifecycleService.processAfterUpdate(accounts, oldMap);

        Integer usedCpu = Limits.getCpuTime() - startCpu;
        Test.stopTest();

        System.assert(
            usedCpu < 7000,
            'Bulk Account lifecycle processing used too much CPU: ' + usedCpu + ' ms'
        );
    }
}
A strict CPU assertion can be controversial. I use it selectively for known-heavy services. If the number becomes flaky, I replace it with query/DML count assertions and test data volume coverage. But I want some automated pressure against performance regressions.
Do not ignore Flow
Apex developers love blaming Flow. Flow builders love blaming Apex.
In real orgs, both are usually involved.
For CPU issues, inspect record-triggered Flows with the same discipline:
- Are entry criteria selective?
- Are decision checks preventing unnecessary updates?
- Are loops doing assignment work inefficiently?
- Are Get Records elements inside loops?
- Is the Flow updating the record that started the transaction?
- Is the Flow duplicating Apex logic?
With Salesforce API v64.0 and the Summer ’26 platform, you have better metadata and observability options than older orgs had. Use them. Pull metadata, inspect automation, and document the transaction path. Do not troubleshoot CPU by staring at one trigger file.
My CPU fix checklist
When I am brought into an Apex CPU limit problem, I go through this sequence:
- Reproduce with realistic data volume.
- Identify the exact transaction path.
- Add CPU probes around service boundaries.
- Check trigger recursion and repeated updates.
- Filter unchanged records early.
- Replace nested loops with maps.
- Reduce query result size.
- Remove duplicate Flow/Apex logic.
- Move non-critical work async.
- Add a bulk performance test.
That order matters. If you start at step 9, you are probably hiding the actual design flaw.
The real fix
The real apex cpu limit error fix is not a syntax trick.
It is this:
Make the transaction do less work.
That means fewer records processed, fewer loops, fewer recalculations, fewer repeated updates, fewer automation collisions, and cleaner sync/async boundaries.
Apex CPU problems are architecture feedback. Listen to them.
TL;DR
- The real Apex CPU fix is reducing wasted transaction work, not blindly adding Queueables.
- Start with transaction mapping, CPU probes, change filtering, maps, and selective queries.
- Use async only for work the user does not need before commit.